Deep learning with galaxy images
Welcome! In this first post to my blog, we will take a deeper look at galaxy images. Why should we bother measuring the metallicities, or elemental abundances, of other galaxies? And why would we use convolutional neural networks? Read more to find out!
Two years ago, I was getting close to the end of my astrophysics PhD program. I had always been interested in statistical methods and machine learning, but never made the leap into deep learning territory. Andrew Ng's legendary machine learning course was an excellent introduction to building simple neural networks from scratch, but I wasn't sure what to do next. What I really needed was an astrophysics research project!
Around this time, I was fortunate enough to hear about the Fast.ai "Practical Deep Learning for Coders" (2018) course, which introduced deep learning using a top-down approach. The course also served as a guide for using the Fastai codebase, which is built atop Pytorch. I also noticed that some Fastai users were interested in applying their knowledge to the Kaggle GalaxyZoo classification challenge, which used galaxy image cutouts as their primary source of data. Since I was already interested in galaxy evolution, it seemed like a good idea to think about the types of problems that could be solved using similar data sets.
With the right tools in hand, I teamed up with a postdoc, Steven Boada, and began working on my first deep learning project...
We see galaxies as gravitationally bound collections of stars, gas, and dust. Galaxies grow by forming new stars out of cold gas, most of which is hydrogen, the lightest and most abundant element in the Universe. Over the course of the stars' lifetimes, heavy elements are fused and eventually strewn across the galaxy through a combination of stellar winds and supernova explosions. Since heavy elements can only be produced inside stars, the ratio of heavy-to-light element abundances is a key measurable for understanding the galaxy's history of star formation and gas accretion. This abundance ratio of heavy-to-light elements is known as the metallicity. Galaxies which have formed more stars tend to also have higher metallicity.
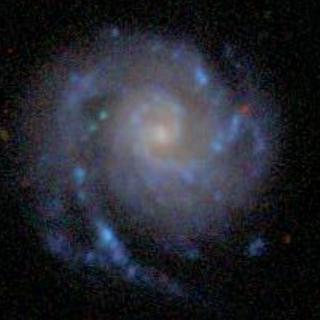
This galaxy, NGC 99, is a nearby star-forming spiral galaxy. Its blue color indicates the presence of newly formed stars, which burn brightly but haven't lived long enough to expel lots of heavy elements into the their surroundings. For this reason, we might expect NGC 99 to be relatively low in metallicity.
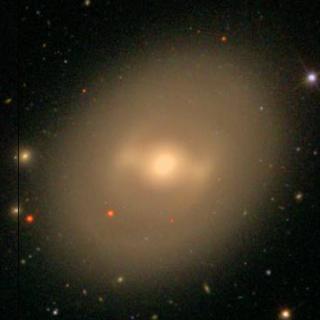
NGC 936 is a redder galaxy, signifying that it has not formed any new stars for a while. Nearly all of its massive, short-lived stars have fused heavy elements and dispersed them throughout the interstellar medium. It does not appear that any pristine, mostly hydrogen (i.e., low-metallicity) gas has recently accreted into the galaxy -- since that would trigger a round of star formation marked by bright blue stars -- so we can infer that this galaxy has fairly high metallicity.
Metallicity does a great job of summarizing a galaxy's evolutionary history, but it's not so easy to measure. Typically, astronomers measure the ratio of oxygen to hydrogen atoms in a galaxy, and spectroscopic observations are required for inferring these elemental abundances. Spectroscopy takes much more time than imaging, and is not as easy to do for many objects at once!
The physical processes that determine a galaxy's metallicity also leave imprints on the galaxy's morphology. The structure and color of a galaxy provide us with a rich description of its growth and evolution. Thus, it would make sense that image cutouts might contain enough information for estimating a galaxy's metallicity.
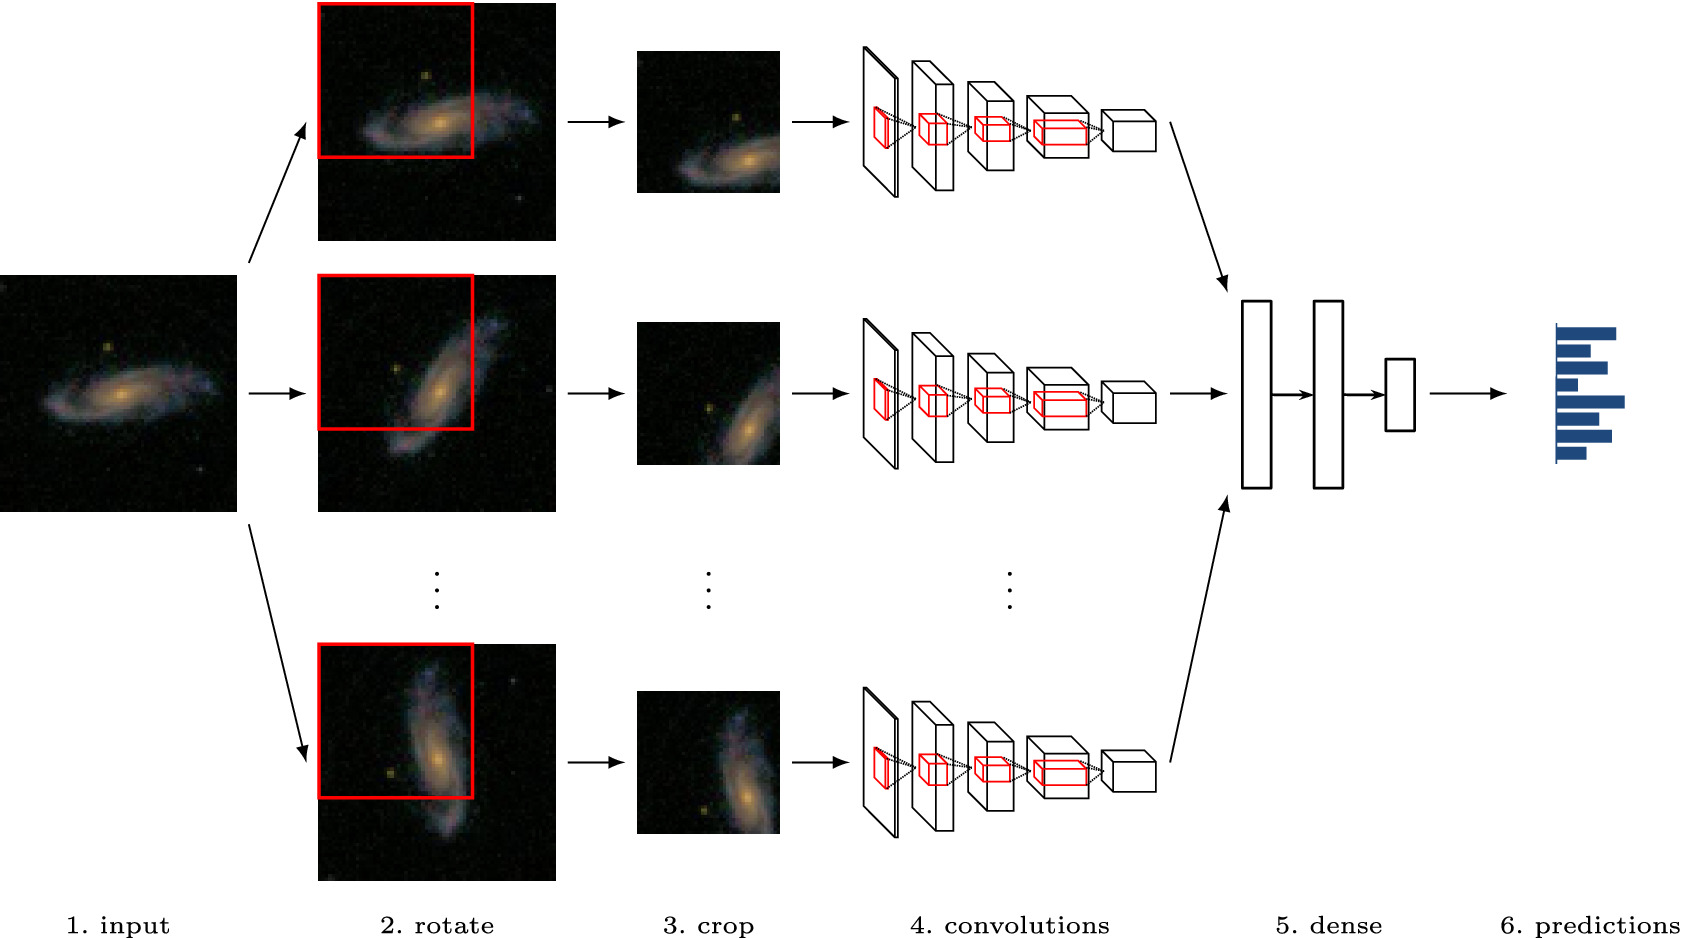
We train a deep convolutional neural network (CNN) to predict the metallicity directly from imaging. The images are queried from the Sloan Digital Sky Survey (SDSS) SkyServer in JPG format, and consisted of $128 \times 128$ pixel images in three colors ($i$, $r$, and $g$ bands corresponding to RGB channels). All in all, we grab about 130,000 galaxy images, and set aside approximately 60% for training, 20% for validation, and 20% for testing.
After only 30 minutes of training on a single GPU, we were able to predict the metallicity of any given galaxy to within 0.085 dex (root mean squared error). This means that our hunch was correct: galaxy images are enough for accurately estimating their metallicities!
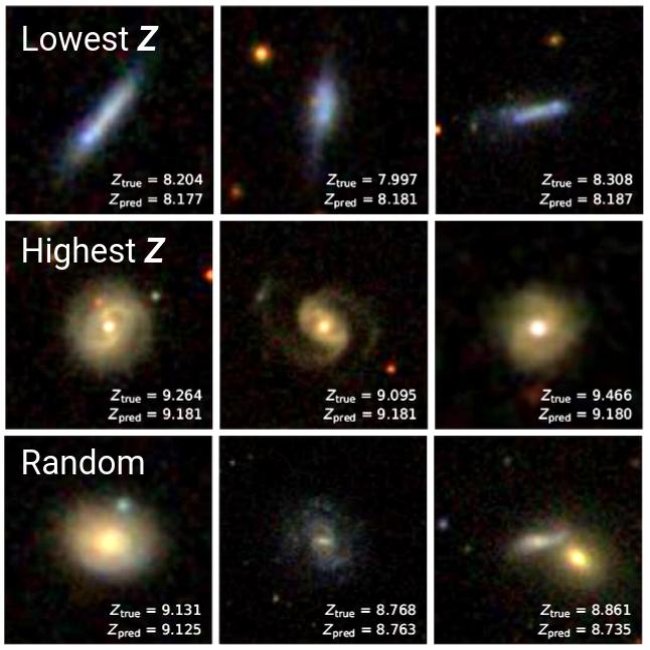
In the figure above, $Z$ represents metallicity, and $Z_{\rm pred}$ and $Z_{\rm true}$ are the CNN-predicted and spectroscopic metallicties, respectively. We are showing a few low-metallicity galaxies (top row), high-metallicity galaxies (middle row), and randomly selected galaxies. We find that our previous intuitions are confirmed!
As we have discussed, it is well-known that galaxies' star formation and chemical evolution histories are connected. Previous astronomers have measured a strong correlation between the stellar masses and metallicities of galaxies (forming the so-called mass-metallicity relation, or MZR). Although it is observationally difficult to measure the metallicities of other galaxies, it is easy to measure their stellar masses. So how do we know that the neural network isn't learning the galaxies' stellar masses, and simply converting these into metallicities via the MZR?
We decided to investigate the relationship between galaxy masses and metallicities measured two ways. The original MZR is constructed from observed metallicities (shown in black below), and we also use CNN-predicted metallicities (shown in red below) to reconstruct the MZR.
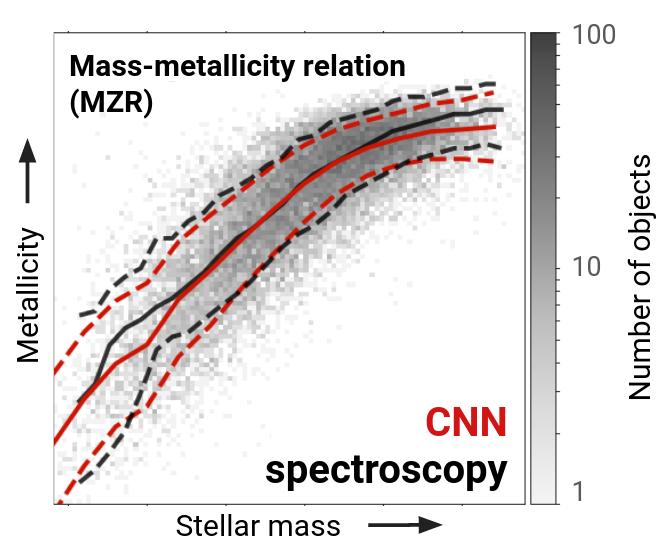
The two versions of the MZR are extremely similar! Both the CNN predictions and the optical spectroscopy give metallicities that correlate with stellar mass to within 0.10 dex (i.e., extremely tight scatter). But the optical spectroscopy served as the ground truth for our CNN, so how could it be that the CNN predictions do not add even a little extra scatter into this original relationship?
It appears that the CNN is using morphological information to characterize galaxies in a way that explains some of the variance in the MZR. In other words, the MZR does not represent the intrinsic scatter due to the physics of galaxy formation and evolution; rather, some of this scatter can be reduced by using other information such as the morphology. (Another possibility is that the galaxy's star formation rate explains some of the scatter, and that we are instead leveraging this information, but this is unlikely given the fact that we do not study the blue/ultraviolet light from these galaxies.)
In our paper, which was published in Monthly Notices of the Royal Astronomical Society and can be found on NASA ADS and arXiv, we trained a CNN to predict the metallicity directly from optical-wavelength images. The results were far better than we could have imagined at first: we could accurately estimate the metallicity to within 0.085 dex, and we found that the reconstructed mass-metallicity relationship using CNN predictions had extremely narrow scatter (0.10 dex).
These findings imply that morphological information is essential for understanding how galaxies grow and evolve. Although classification systems and simple parameterizations of their morphological features are useful for encoding this information, they are not nearly as flexible as CNNs.
If you're interested in seeing some of the more technical details, then please stay tuned for my next post (update: here it is)! I'll be showcasing some of the analysis using the Fastai v2 codebase. Otherwise, take a look at the original Github repository for the paper, or a demo version of the code (which includes a small subset of the data).